Australian equities have been a challenging asset class for investors, with subdued earnings growth at the index level and a market dominated by large-cap, cyclical businesses.
A key structural issue is Australia’s dividend imputation system, which incentivizes corporates to boost dividend payout ratios in the short term at the expense of long-term reinvestment, stifling growth. As a result, S&P/ASX200 index returns have relied more on rising valuations than on earnings fundamentals—particularly in sectors like Financials.
Quality Performance
AQLT
Australian Quality ETF
offers exposure to a portfolio of 40 high-quality Australian companies selected based on high return on equity, low leverage and relative earnings stability. Quality companies have the potential to compound earnings growth into capital gains over time.
Since inception on 4 April 2022, AQLT has delivered:
- Total return of 10.0% p.a., outperforming the S&P/ASX 200 Index (6.6% p.a.)
- Top 1% ranking among Australian Large Cap equity funds over 3 years
This performance stands out in a market where most active managers have underperformed their benchmarks.
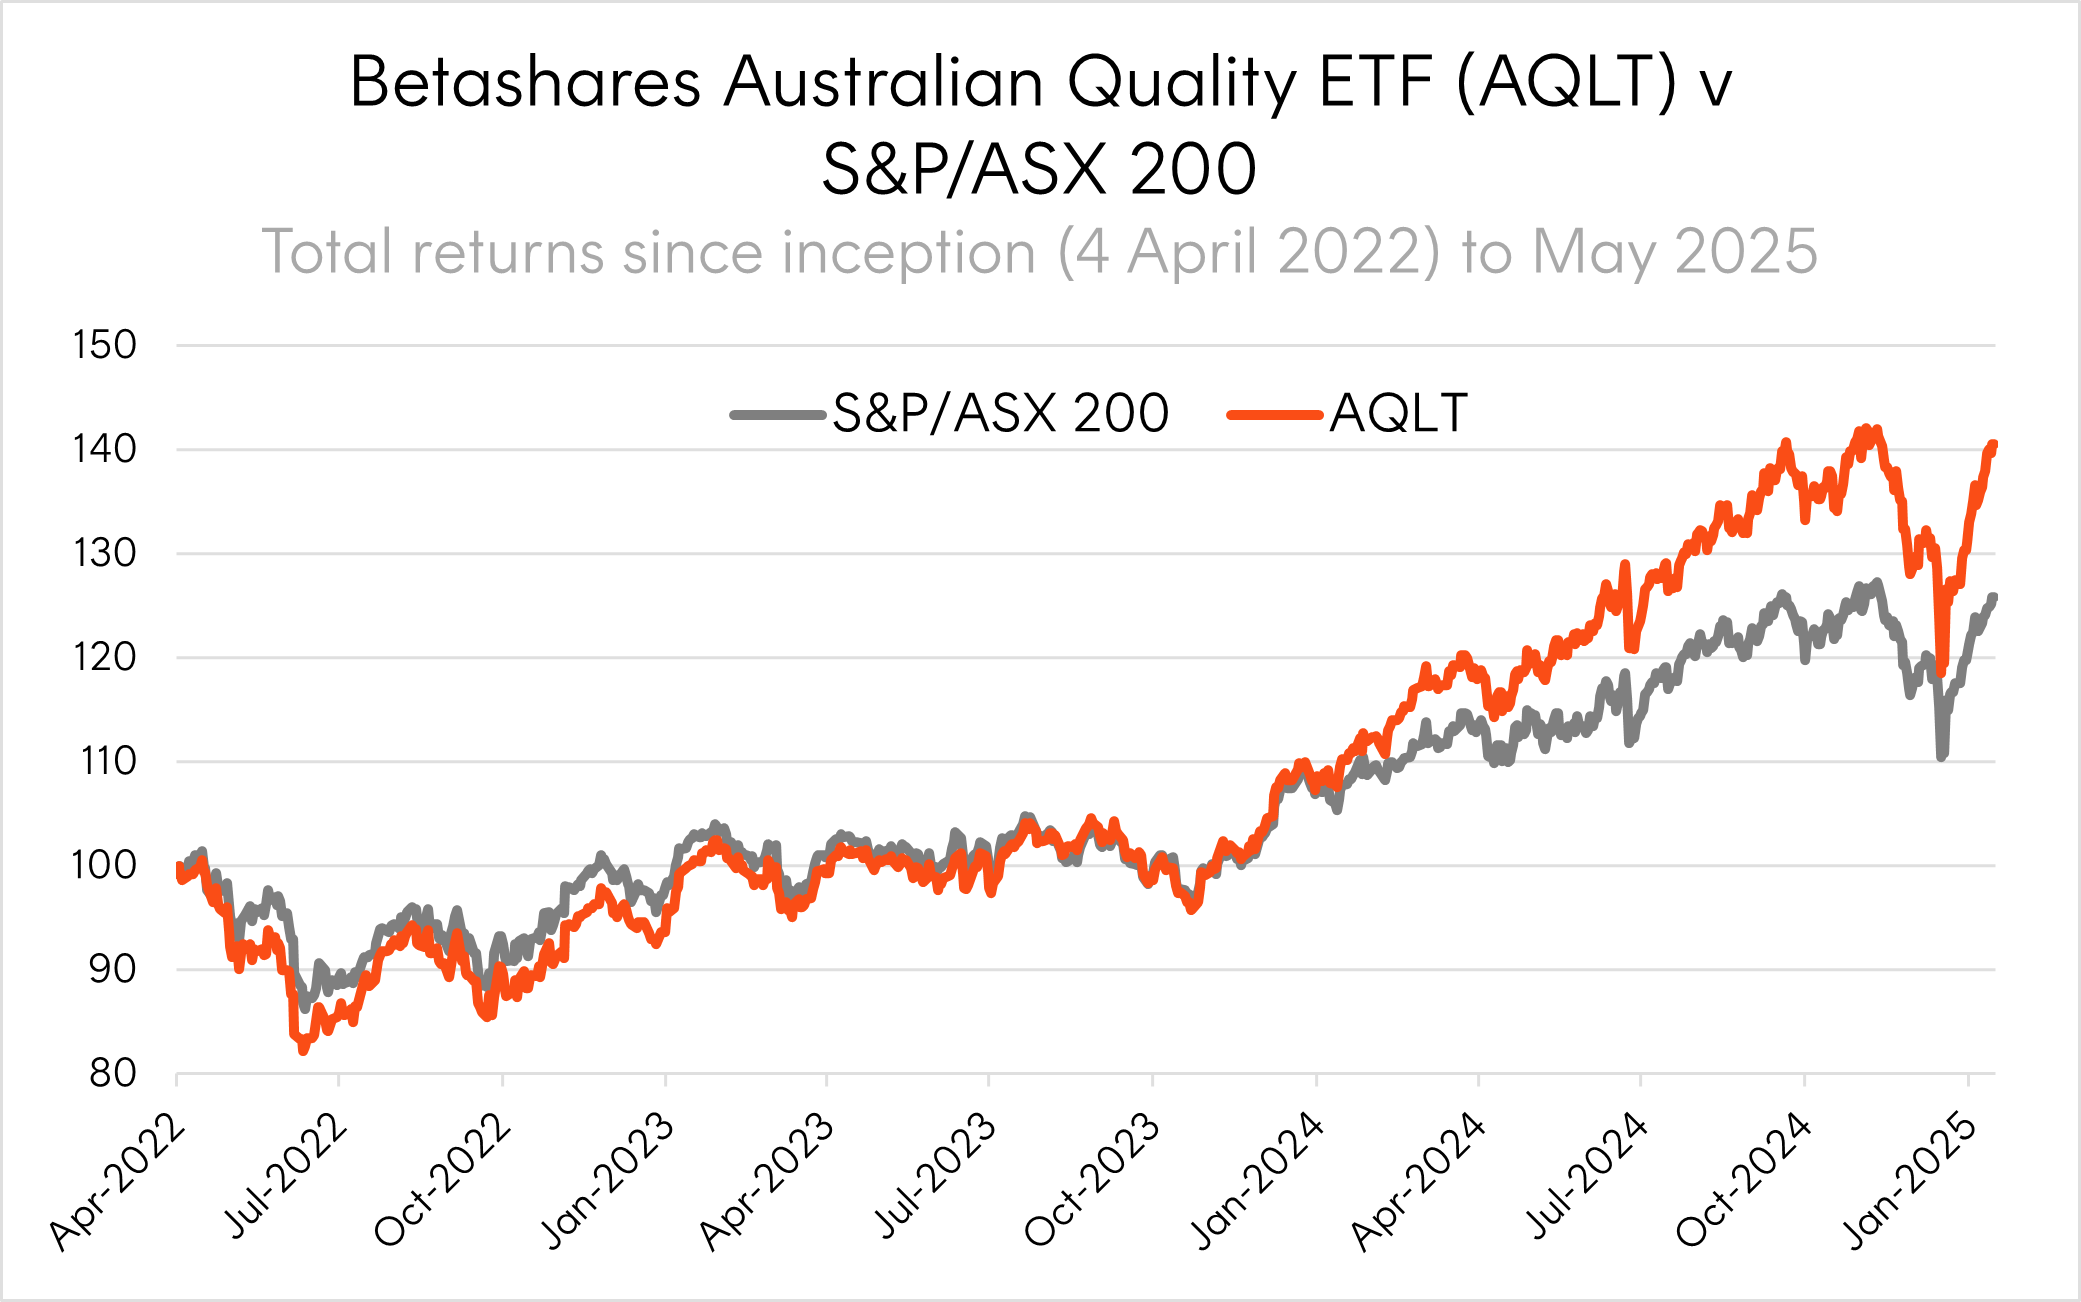
Source: Bloomberg, as at 18 May 2025. You cannot invest directly in an index. AQLT performance is net of AQLT’s management fee of 0.35% p.a. Past performance is not an indicator of future performance of any index or ETF.
Underwritten by strong fundamentals
We have commented previously on how AQLT’s performance has been underpinned by solid fundamentals. The earnings season for the first half of 2025 adds weight to that argument, highlighting the quality of companies within AQLT’s portfolio (selected from the largest 200 listed on the ASX):
- Only 1 company held in AQLT’s portfolio reported a loss (IGO Ltd).
- 19 out of 136 companies (14%) not selected by AQLT’s index for inclusion in AQLT reported losses.
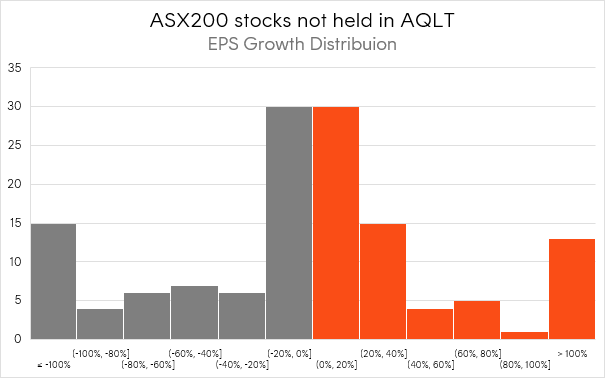
Furthermore, the earnings growth of stocks held by AQLT reinforces the difference. The first chart below shows the distribution of EPS growth for companies within AQLT’s portfolio, the second chart shows the EPS growth distribution for companies not selected within AQLT’s portfolio.
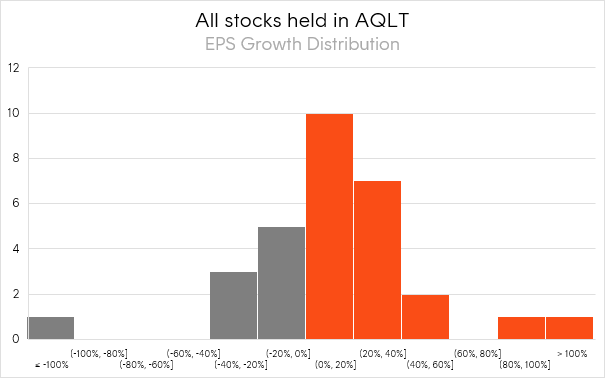
Source: Bloomberg, as at 18 May 2025. EPS growth figures are included for all stocks reporting between January – March 2025. You cannot invest directly in an index. Past performance is not an indicator of future performance.
Orange and grey shading delineates between stocks that have experienced positive and negative EPS growth, respectively.
The majority of AQLT companies posted solid earnings growth in the first half of 2025, underscoring the strategy’s quality tilt. Comparing the two distributions:
- 70% of AQLT’s portfolio posted positive EPS growth.
- In contrast, only 50% of companies not selected for inclusion in AQLT’s portfolio reported EPS growth, with a high number recording significant declines (as shown by the grey bars for EPS growth below -40%.).
Upweighting Quality in Australian Equities
In a market dominated by cyclical exposure and constrained capital reinvestment, quality remains an enduring advantage. AQLT’s index provides exposure to:
- the largest companies listed on the ASX, but weighted by quality rather than market capitalisation, meaning you get higher exposure to names like Wesfarmers and Macquarie Group and lower exposure to BHP and CBA, and
- high quality names from the mid and small caps, including Pro Medicus, Hub 24 and Breville
AQLT
Australian Quality ETF
has continued to deliver strong performance supported by superior earnings fundamentals—making it a compelling option for investing in the Australian equity market.
References:
1. AQLT aims to track the Solactive Australia Quality Select Index. The full methodology for the index is available on the fund page here. ↑
2. Return figures are to 30 April 2025. The 3-year performance ranking compares AQLT to all Large Cap Australian Equity funds (including both ETFs and unlisted funds) in Morningstar’s database. Past performance is not an indicator of future performance of any index or ETF. ↑
3. SPIVA Australia Year-End Scorecard 2024. The SPIVA (S&P Index vs. Active) Scorecard tracks the ability of actively managed funds all over the world to beat passive benchmarks. ↑
4. EPS – Earnings per share. The net profit a company produces, divided by the number of shares on issue. For an index, this is generally quoted as a weighted average of the index constituents. ↑
5. AQLT aims to track the Solactive Australia Quality Select Index. The full methodology for the index is available on the fund page here. ↑
6. These holdings are current as at 19 May 2025. Please note, AQLT portfolio is subject to change and there is no guarantee these stocks will remain in AQLT’s portfolio or be profitable investments. ↑


