In the first article of this series, we tackled the problems many investors face – story-driven speculation, tip chasing, and the trap of seeking more and more information which often brings overconfidence rather than better results.
One answer is using a rules-based approach, based around the characteristics of shares proven to identify winners. When you know that there’s a persistent payoff to buying the highest quality, value and momentum shares there can be a real mindset shift.
But for many, that’s where the journey stalls.
Because once you realise that rules matter, the next step is to create your first set.
Price to Earnings Ratio of less than 12? Tick. Return on Capital above 15%? Tick. Debt under control? Tick. You build a rational set of logic, and it feels good.
Until you hit a wall.
(NB – If you’re curious how to go from “first rules” to full portfolio strategy, join me for a live webinar on Thursday 22nd May at 5pm (BST) – details at the end of the article).
The problem with strict rules
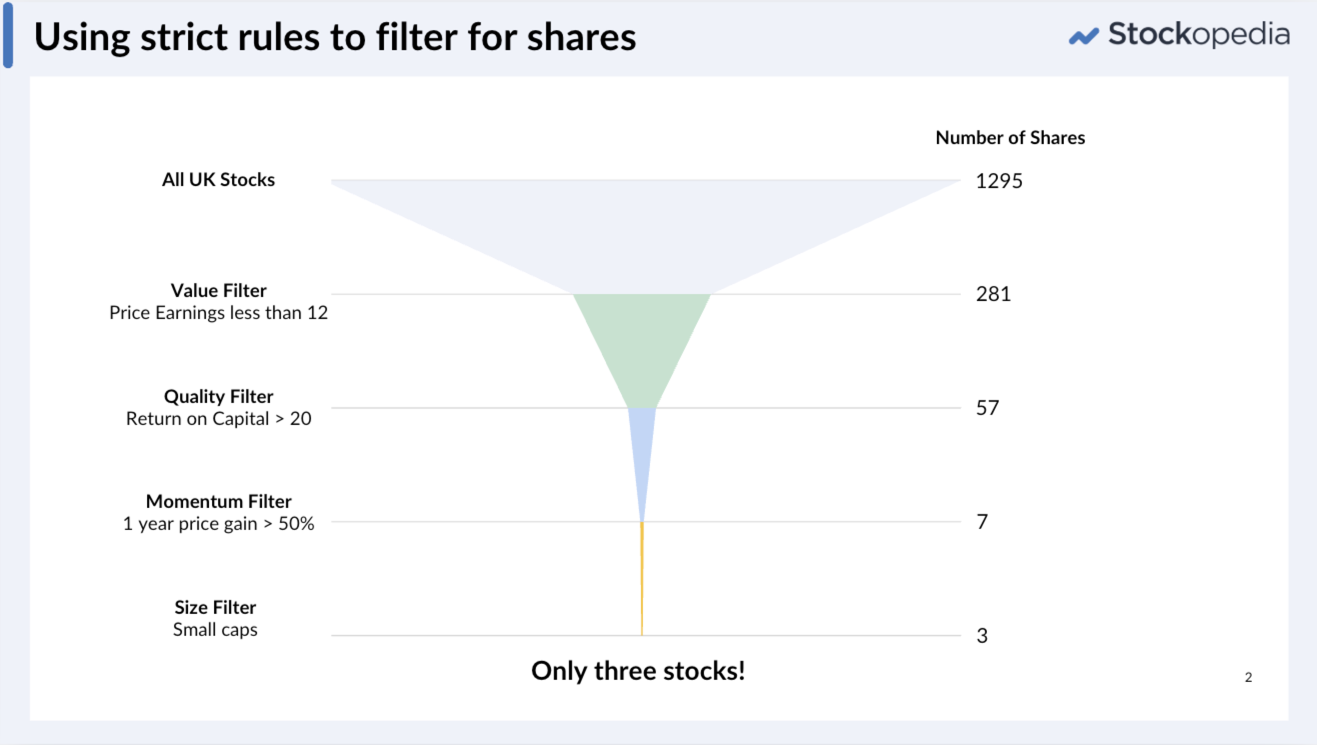
I still remember the buzz of creating my first stock screen. Stock screens are essentially checklists of rules that can narrow a universe of thousands of stocks down to a manageable list.
My first was based on Jim Slater’s criteria from his excellent Zulu Principle book. I had a whole list of “must have” criteria which would find me reasonably priced, quality growth shares. But how many candidates did the screen produce?
Just three. Two were rather small and illiquid and the third was some obscure foreign-listed firm. It was quite disappointing. And it certainly wasn’t an investable portfolio.
Checklists can be powerful – don’t underestimate them. They add discipline to your investing and help filter out the noise. But they be extremely restrictive.
If a stock has a P/E of 12.4 but you’ve screened for less than 12, should it really be cut out? Of course not. But a strict set of rules won’t catch it.
So what do you do?
You start raising all your cutoffs – you find a broader set – but something feels amiss. You know your cutoffs are keeping out some of the best candidates in the market.
From strict criteria to solid scoring
The breakthrough for me came when I stopped thinking so binary – in pass/fail terms – and came across the idea of scoring. It was Joel Greenblatt, in his excellent “The Little Book that Beats the Market”, that sowed the seed.
What if, instead of demanding that a company have a P/E of less than 12, you scored every stock in the market for how low the price earnings ratio was? And another for how profitable it was – using its “return on capital”.
Rather than just having a hard cutoff for “cheap” or “good” shares, you could create a gradient – with “cheap, highly profitable” stocks at one end, and “expensive, unprofitable” shares at the other.
It’s a fundamentally different approach. You’re no longer left with just a few stocks, you have a score for every stock in the market. And what’s even better, you can then compare any stock against any other.
Building your own DIY scores
You can do this even if you are a stock picker, looking at stocks on a case by case basis. You can build a set of solid rules, which can even include qualitative assessments like “how experienced and trustworthy is the management”, and grade stocks between zero and ten for each rule.
I know some of the best investors in the UK that do this. It does require judgement, but it removes a lot of bias from your investing process, and helps you avoid getting too sucked into a story.
But a more data-first approach allows you to compare all the stocks in the market.
If you like doing your own work, you can do this yourself – you will need access to a financial database to export some data. Some are free on the web, though you do have to be careful with data quality. But it’s really worth it.
Choose some key metrics across a few of the quality, value and momentum dimensions. For example as I’ve described you might choose the P/E ratio and the return on capital (a key profitability measure). Score each one as a percentage from zero to 100, where 100 is “best”.
Total the scores and rank again. You can then use this score to check your own stock ideas against. It’s not hard. And it works.
Check out the illustration in this spreadsheet.
It uses institutional quality data from Stockopedia’s database (correct at the time of publishing).
Take a look and see if you can find any of your shares within it – their scores might surprise you
While this is just a simple example, the benefit of this kind of gradient-based thinking is huge. It can add so much rigour to your process, but more than this – it really gets results.
Taking it further
Scoring the market for a couple of financial ratios isn’t really that robust.
Just scoring for “value” based on the P/E ratio can leave opportunities on the table – what about companies that are cheap relative to their company sales, but are just turning profitable? When their sales grow, they can see huge profit expansion.
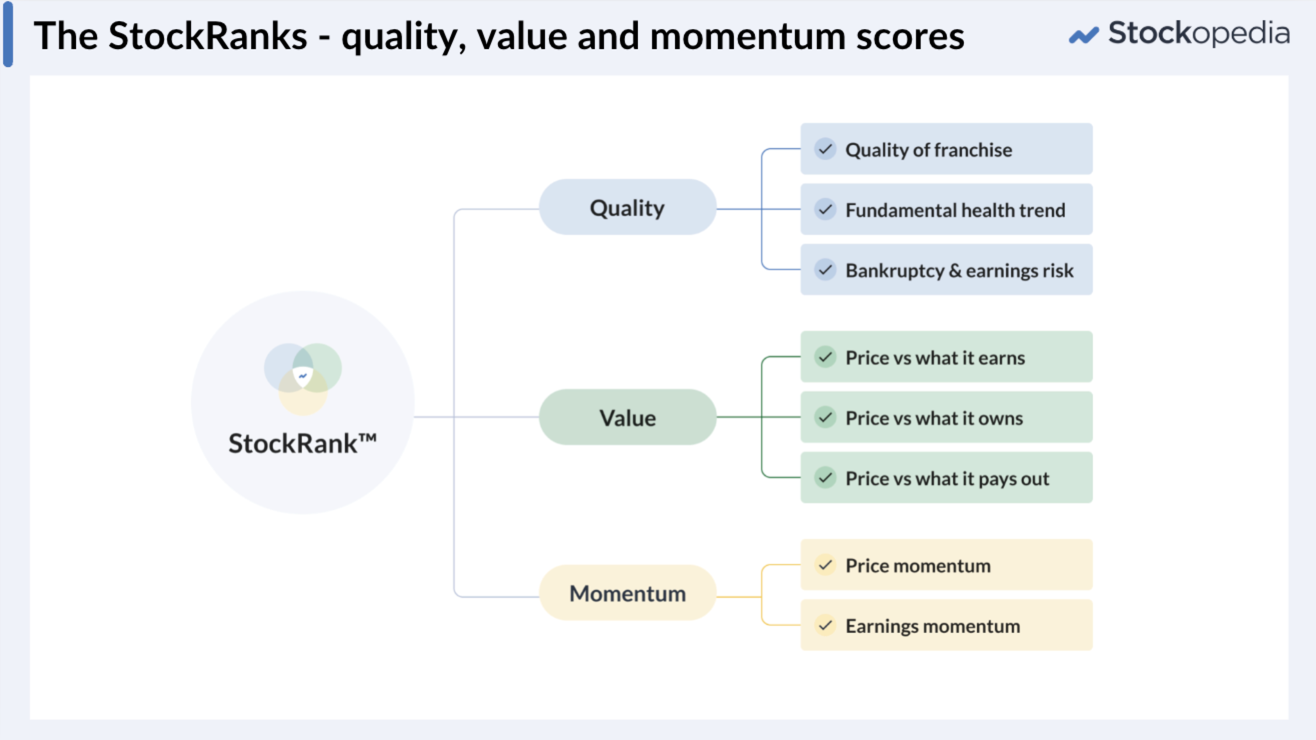
So at Stockopedia, we built a system that takes this further. Every stock gets a daily score – out of 100 – based on its Quality, Value, and Momentum profile – but each of these scores is built from a range of financial ratios, to give a more robust and rounded guide to their relative merit.
We call these measures the StockRanks and they have a terrific track record of finding stocks that perform.
Top ranked stocks through time have included many of the very best multibaggers in the UK market – stocks like Rolls Royce, Games Workshop, Jet2 and more – before they took off.
The top 10% of ranked shares – those in the 90+ range – have on average returned 11.9% annualised. And the lowest ranked 10%? Well more than 75% of them end up losers – with an average annualised return of -17%.
Now, this doesn’t mean every 90+ ranked stock is going to be a winner. Of course not. A good score is not a buy recommendation. Individual stocks do their own thing, profit warnings happen and markets go down as well as up. But across groups of stocks, over the longer term, the odds weigh in your favour. That’s what matters.
Learn to build a portfolio that captures the 90+ effect
Having a great scoring system helps you track down high potential stocks with a lot more ease and less emotional attachment. And because there’s no hard cutoff, you can always build a portfolio. But just taking the top 20 stocks is not a complete investment process.
Join us for a free, live webinar to dive deep into this subject on Thursday 22nd May at 5pm (BST):
“The Smarter Way to Build a Market Beating Share Portfolio”.
Registration is free, and if you can’t make the date you can catch the replay by registering here.
I’ll be covering a complete process. Not only to pick high potential stocks, but to construct a portfolio with both the diversification required to manage risk, and the discipline to consistently capture the returns. We’ll show how this process has delivered a portfolio that beat every fund manager in the UK over the last decade – which we’ll continue to discuss in our next article.


